
JINIers
[PCK] Monitoring Applications in Google Cloud lab 본문
작업 1. github 에서 샘플 앱 다운로드
mkdir gcp-logging
cd gcp-logging
git clone https://GitHub.com/GoogleCloudPlatform/training-data-analyst.git		# python flask 앱 복제

cd training-data-analyst/courses/design-process/deploying-apps-to-gcp
open editor > new windows > deploying-apps-to-gcp 폴더 > main.py >
파일 맨 위에
import googlecloudprofiler 추가
* nano로 추가해도 댐(저장 : ctrl+o, enter, ctrl+x)
12번째줄에 추가
try:
    googlecloudprofiler.start(verbose=3)
except (ValueError, NotImplementedError) as exc:
    print(exc)
[main.py 파일 최종]
# main.py

import googlecloudprofiler
from flask import Flask, render_template, request

app = Flask(__name__)


@app.route("/")
def main():
    model = {"title": "Hello GCP."}
    return render_template('index.html', model=model)


try:
    googlecloudprofiler.start(verbose=3)
except (ValueError, NotImplementedError) as exc:
    print(exc)

if __name__ == "__main__":
    app.run(host='0.0.0.0', port=8080, debug=True, threaded=True)
requirements.txt 열기 > 마지막 줄에 google-cloud-profiler 추가
# 프로파일러 활성화
gcloud services enable cloudprofiler.googleapis.com

# 파일 설치
sudo pip3 install -r requirements.txt

# 프로그램 실행
python3 main.py
web preview > port 8080 눌러 > 새 탭에 'hello GCP'가 뜨면 성공! > ctrl+c로 실행중지
작업 2. app engine에 애플리케이션 배포
code editor >
deploying-apps-to-gcp 폴더 > new file > app.yaml 생성 > 내용입력 > save
[app.yaml]
# app.yaml
runtime: python37
# 앱 생성 지역 지정
gcloud app create --region=us-central
# 앱 배포
gcloud app deploy --version=one --quiet
app engine > dashboard > 링크표시 눌렁

작업 3. cloud 로그 검사
app engine > versions > diagnose 'tool' -> 'logs' > 로그 프로파일 시작
프로파일이 생성되고 있음!


작업 4. 프로파일러 정보보기
콘솔탭 > Profiler > 창 확인 > compute engine > create instance > zone : us-central1이 아닌 다른 곳으로 변경 후 그대로 만들기 > 'instance-1' ssh

instance-1 ssh>
sudo apt update
sudo apt install apache2-utils -y

# app engine 애플리케이션에 대한 일부트래픽 생성
ab -n 1000 -c 10 https://<your-project-id>.appspot.com/

#응용프로그램에 대해 한번에 10개씩 1000개의 요청을 생성
ab -n 1000 -c 10 https://qwiklabs-gcp-02-fb1e952c9e59.appspot.com/
다시 콘솔 > Profiler > 그림처럼 떠야되는데 왜......ㅜㅜ

안뜨면 다시해봐..
작업 5. cloud trace 탐색
앱콘솔 > trace > trace list > 요청 명령어 다시 입력 > 확인
ab -n 1000 -c 10 https://qwiklabs-gcp-02-fb1e952c9e59.appspot.com/
ab -n 2000 -c 10 https://qwiklabs-gcp-02-fb1e952c9e59.appspot.com/
ab -n 3000 -c 10 https://qwiklabs-gcp-02-fb1e952c9e59.appspot.com/
작업 6. 대시보드를 사용하여 리소스 모니터링
Monitoring > dashboards > app engine dashboard 클릭 > 프로젝트 이름 클릭

Monitoring > dashboards > vm instance dashboard 클릭 > 인스턴스 이름 클릭

Monitoring > dashboards > create dashboard > 사용자 지정 대시보드 생성 가능
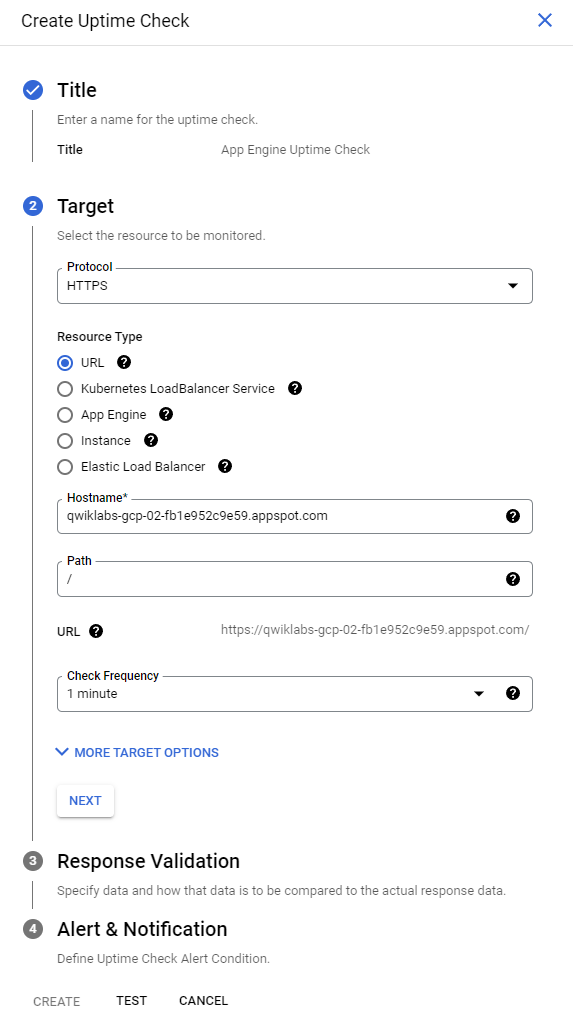
작업 7. 가동시간 확인 및 알림생성
Monitoring > Uptime checks > create uptime check > 구글에서 지정한대로 생성 > test > 녹색표시 확인 > create

alerting > edit notification channels > 이메일 추가 > alerting 탭 돌아가기 > 새로고침 > 하니까 lab 평가가 된다.???

app engine > setting > disable application 클릭 > 앱 아이디 넣고 disable > app engine dashboard 눌러 > url 눌러 > 확인 > monitoring > uptime checks 비활성화 확인 > alerting 확인 > app engine 들어가서 애플리케이션 다시 enable 시킴 > uptime checks 확인


