
JINIers
220524_BigQuery in JupyterLab on Vertex AI 2.5 본문
개요
- vertex ai에서 jupyter 노트북 인스턴스화
- jupyter 노트북 내에서 bigquery 쿼리를 실행하고 pandas를 사용하여 출력 처리
작업 1. jupyterLab 노트북 인스턴스 시작
vertex ai > workbench > user-managed notebooks > new notebooks > python3 > create > jupyterlab 열기
작업 2. bigquery 쿼리실행
[1] google cloud 모듈설치
!pip install google-cloud-bigquery==1.25.0 --use-feature=2020-resolver
실행 후 restart kernel > restart

[2] 마술기능 사용 쿼리
%%bigquery df                                    # %%bigquery : 마술기능제공
SELECT
  depdelay as departure_delay,
  COUNT(1) AS num_flights,
  APPROX_QUANTILES(arrdelay, 10) AS arrival_delay_deciles
FROM
  `cloud-training-demos.airline_ontime_data.flights`
WHERE
 depdelay is not null
GROUP BY
  depdelay
HAVING
  num_flights > 100
ORDER BY
  depdelay ASC
[3] 상위 5개의 행을 출력
df.head()

작업 3. make a plot with pandas
[4] 원시 쿼리 출력 랭글링
import pandas as pd
percentiles = df['arrival_delay_deciles'].apply(pd.Series)
percentiles.rename(columns = lambda x : '{0}%'.format(x*10), inplace=True)
percentiles.head()
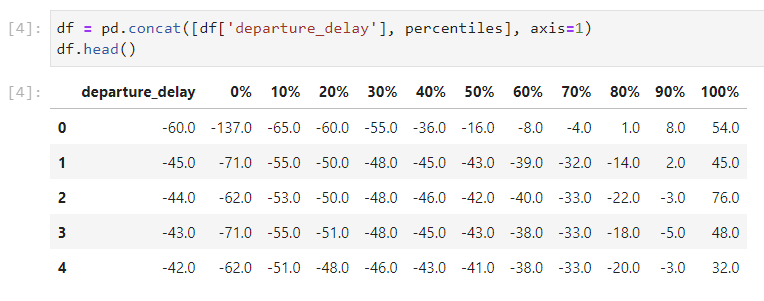
[5] percentiles table - departure_delay dataframe 연결
df = pd.concat([df['departure_delay'], percentiles], axis=1)
df.head()
[6] 필드에 저장된 극단값 삭제
df.drop(labels=['0%', '100%'], axis=1, inplace=True)
df.plot(x='departure_delay', xlim=(-30,50), ylim=(-50,50));
'GCP > Qwiklabs' 카테고리의 다른 글
| 220607_Using BigQuery to do Analysis (0) | 2022.06.07 |
|---|---|
| 220603_Cloud Functions: Qwik Start - 콘솔 (0) | 2022.06.03 |
| 220524_Analyzing Natality Data Using Vertex AI and BigQuery (0) | 2022.05.24 |
| 220520_Vertex AI Platform: Qwik Start (0) | 2022.05.20 |
| 220510_Streaming IoT Data to Cloud Storage (0) | 2022.05.10 |
'GCP/Qwiklabs' Related Articles
more


Comments